1. Introduction to the Fourier Transform
Virtually everything in the world can be described via a
waveform - a function of time, space or some other variable. For instance, sound
waves, electromagnetic fields, the elevation of a hill versus location, a plot
of VSWR versus
frequency, the price of your favorite stock versus time, etc. The Fourier
Transform gives us a unique and powerful way of viewing these waveforms.
The purpose of this entire website is to explain the
following fundamental fact:
The above fact, is exceedingly cool, as we will see. The
Fourer Transform decomposes a waveform - basically any real world waveform, into
sinusoids. That is, the Fourier Transform gives us another way to represent a
waveform. (Need a refresher on sinusoids? See Sinusoid Properties)
As an example, lets break down the waveform in Figure 1 into
its 'building blocks' (or constituent frequencies). This decomposition can be
done with a Fourier transform (or Fourier series for periodic waveforms), as we
will see.
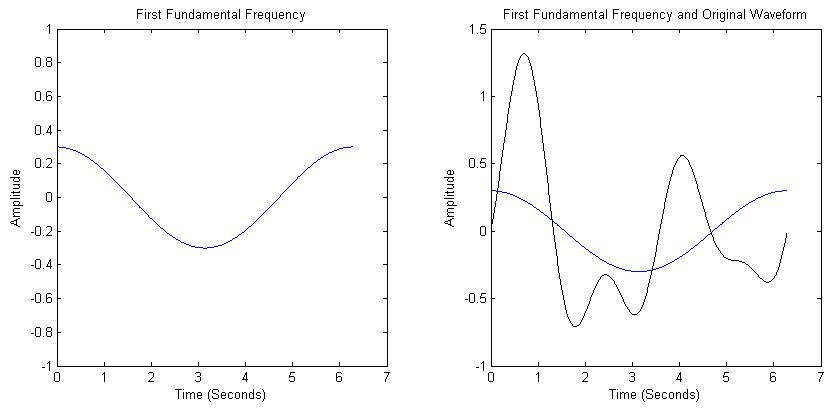
The first component is a sinusoidal wave with period T=6.28
(2*pi) and amplitude 0.3, as shown in Figure 1.
|
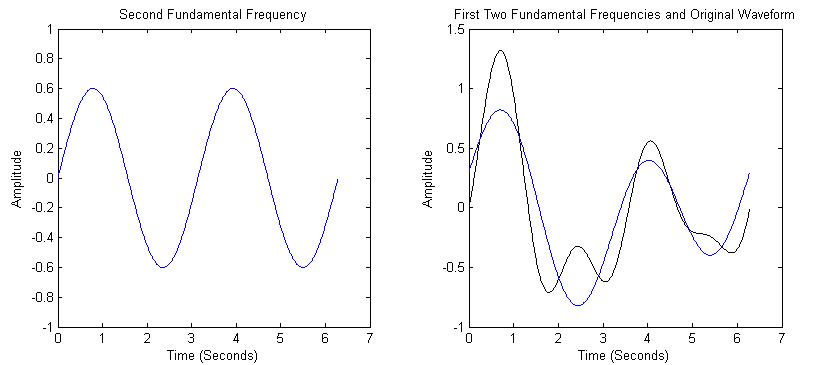
The second frequency will have a period half as long as the
first (twice the frequency). The second component is shown on the left in Figure
2, along with the sum of the first two frequencies compared to the original
waveform.
|
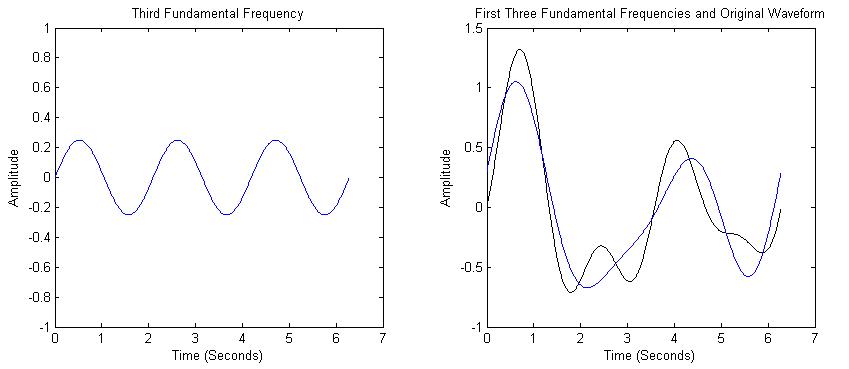
We see that the sum of the first two frequencies is starting
to look like the original waveform. The third frequency component is 3 times the
frequency as the first. The sum of the first 3 components are shown in Figure 3.
|
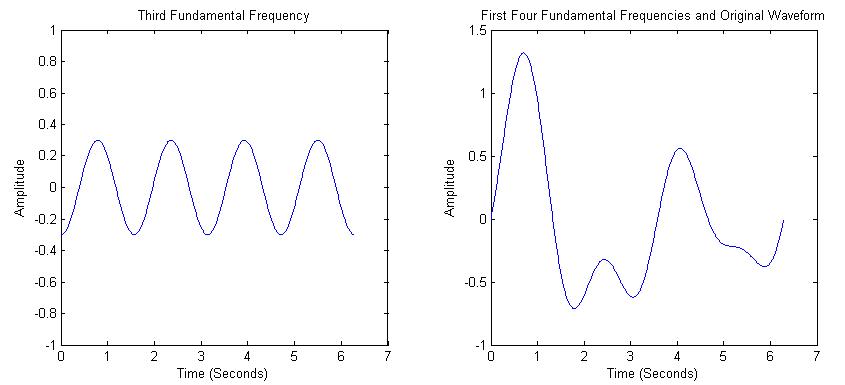
Finally, adding in the fourth frequency component, we get the
original waveform, shown in Figure 5.
|


Aucun commentaire:
Enregistrer un commentaire